The emission of greenhouse gases (GHGs) into the atmosphere is a primary contributor to climate change and has been linked to increases in global temperature and worsening weather extremes. Accelerated human activity and higher energy demands has exacerbated emissions across many sectors, thus further contributing to additional output of GHGs into the atmosphere. A growing awareness of impacts from anthropogenic emissions in recent decades has led to increased environmental monitoring and the development of policy to avert further harm to Earth’s environmental systems. However, more work still needs to be done to identify emission sources and the rate that GHGs are emitted in order to further reduce human-induced impacts and safeguard our future. This is particularly important given the relatively long lifetime of carbon dioxide (CO2; ~100 years) and methane (CH4; ~10 years).
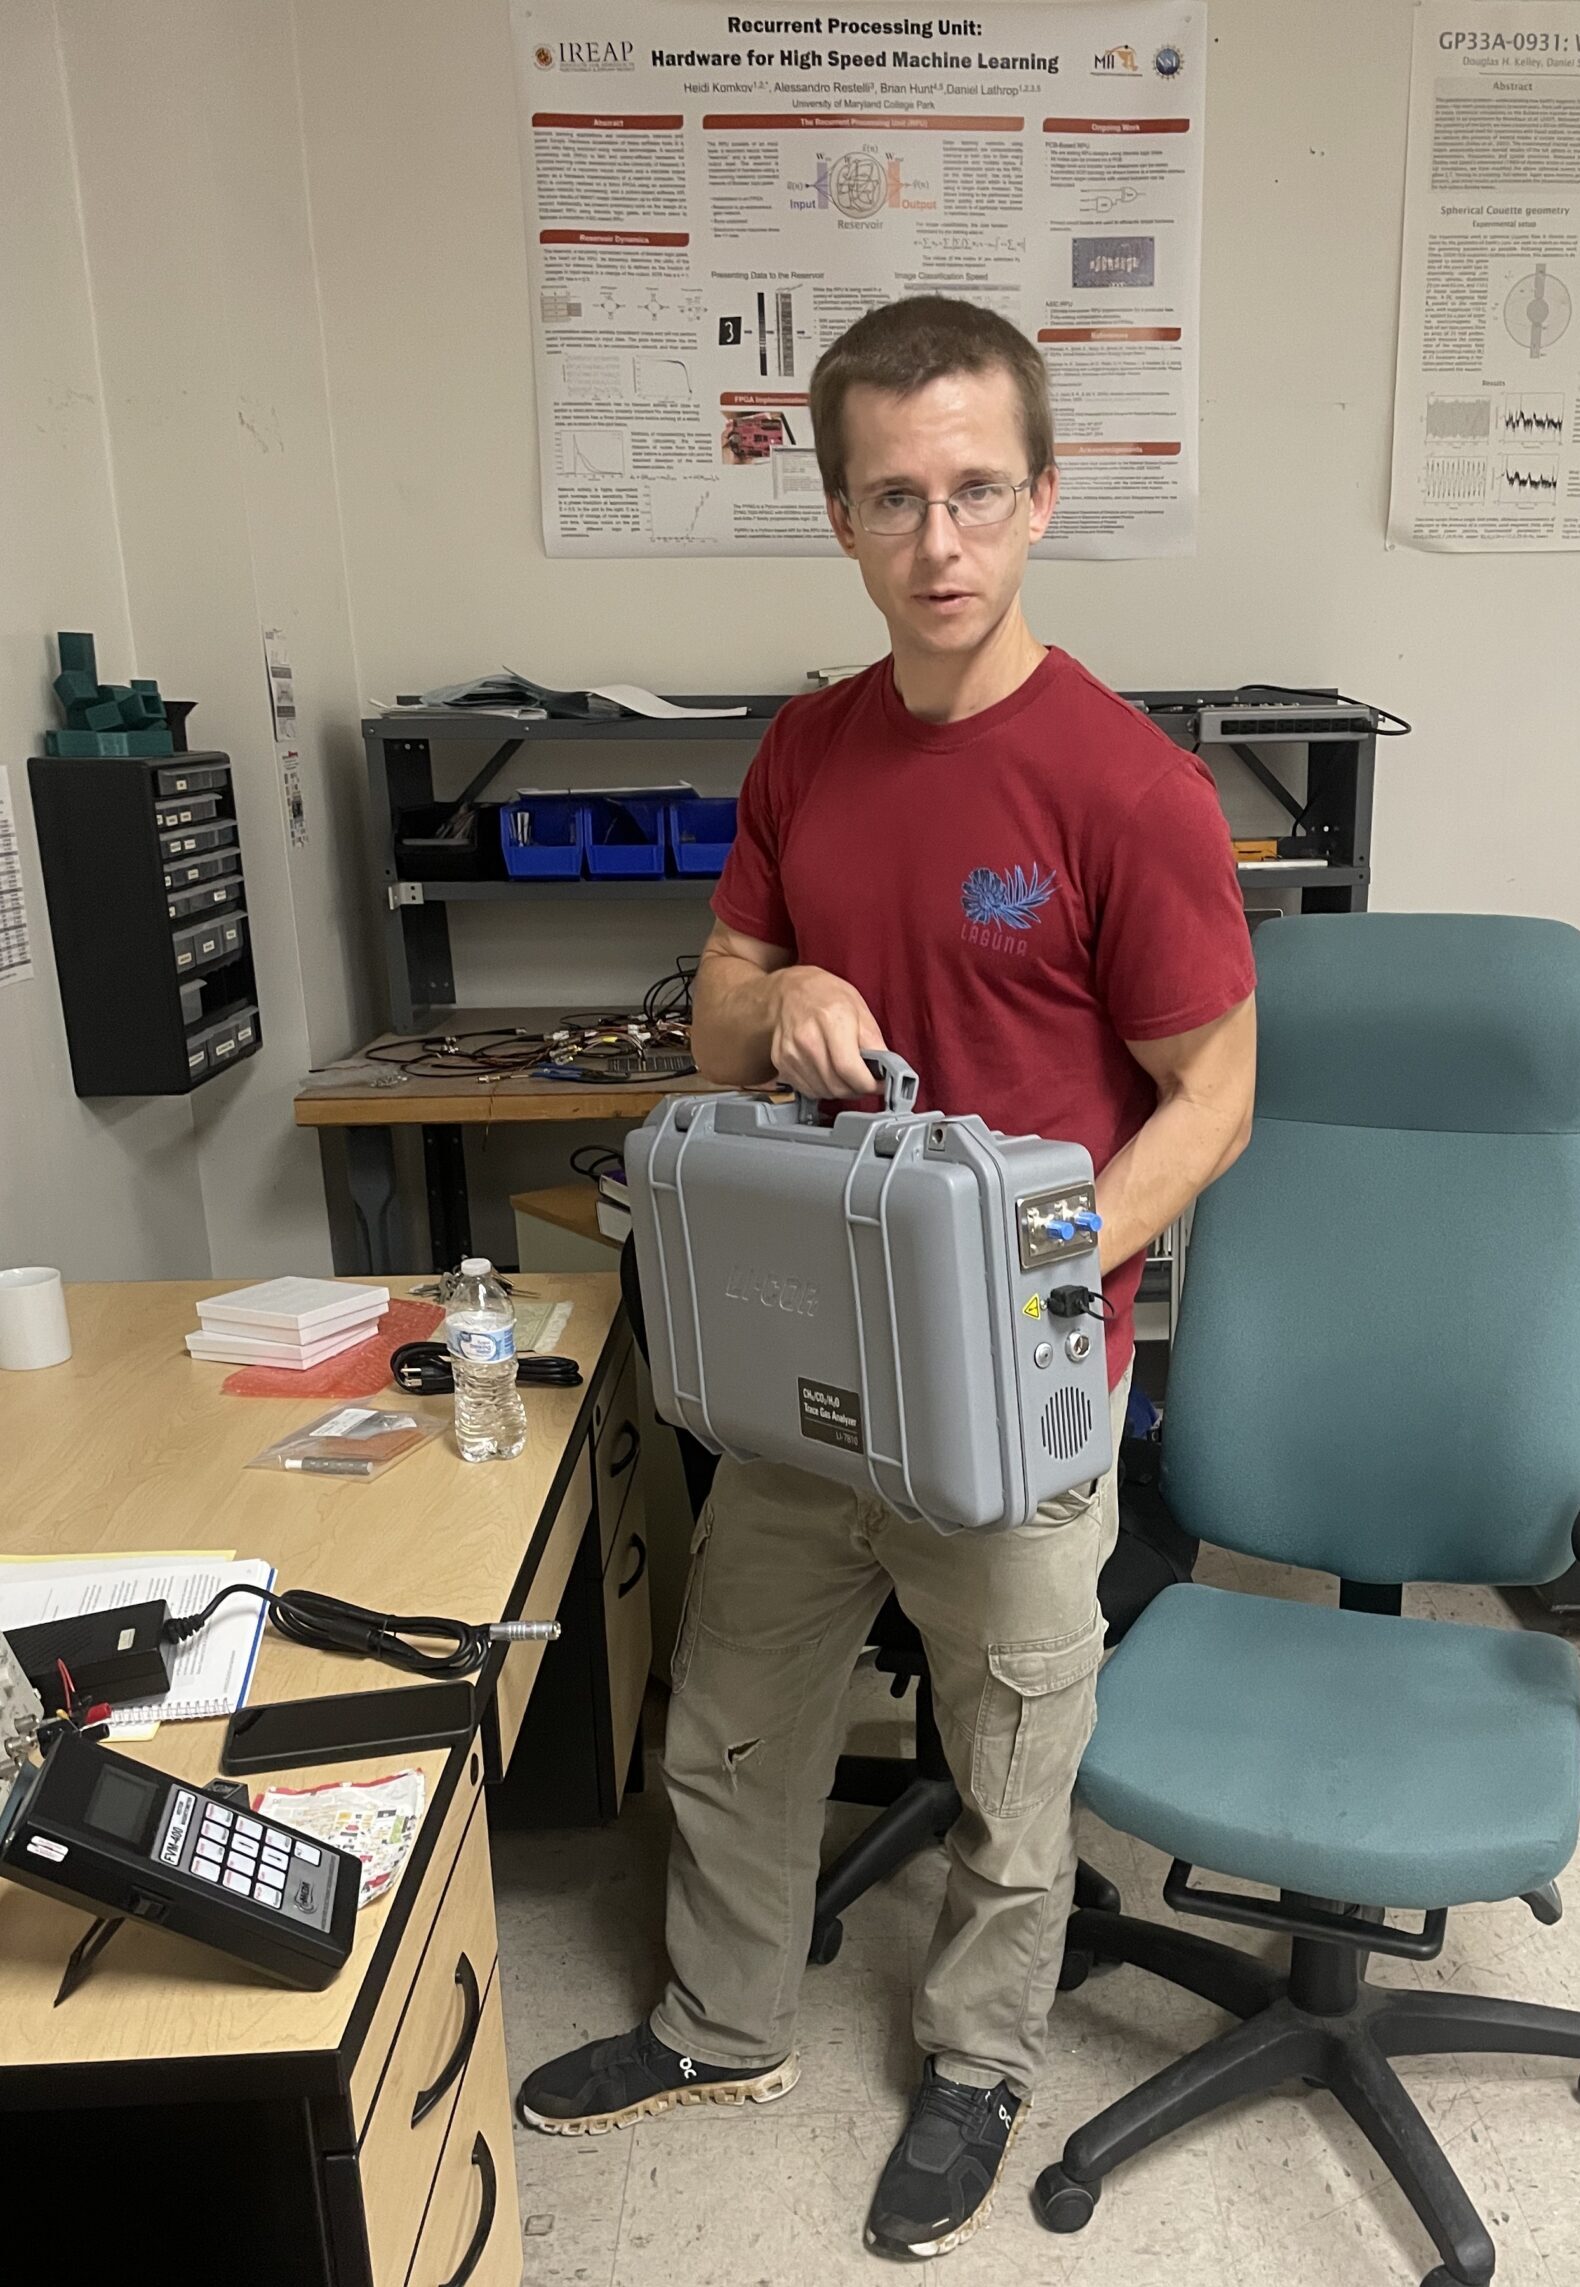
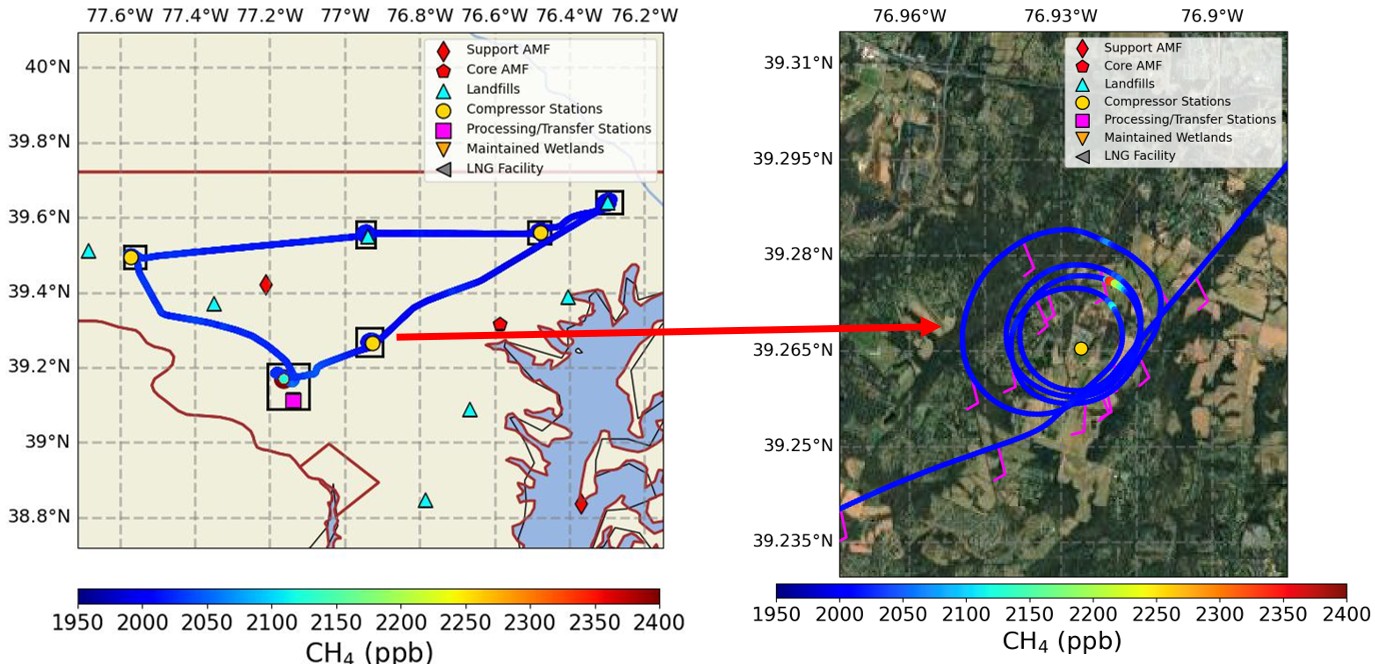
The University of Maryland, College Park (UMCP) has worked at the interface of science and policy to reduce GHG emissions and improve air quality for decades with longstanding partnerships with the Maryland Department of Environment (MDE) and the National Institute of Standards and Technology (NIST). Support from the Grand Challenges (GC) grant has led to the continuation of this work through the acquisition of a Licor 7810 instrument to measure CO2, CH4, and H2O at a 1-second resolution along with the allocation of flight hours stemming from a recent partnership with the Civil Air Patrol (CAP) to conduct aerial surveys across Maryland. So far in 2025, 10 flights have been conducted to target various sources such as landfills, natural gas compressor stations, and a liquid natural gas facility (LNG) at Cove Point, Maryland. Figure 1 below demonstrates an example where a CAP aircraft flew multiple circles at different heights to isolate a GHG plume and determine the rate of emissions from the Ellicott City gas compressor station (right image in figure) to be 437 g/s or about 13.7 kt/yr. Data generated and analyzed from flight exercises such as these are reported to MDE and shared with proprietors of facilities from which the emissions originate in order to further curb emissions.
Plans are currently underway to target additional emission hotspots under the guidance of MDE with the CAP aircraft. Another instrument measuring ozone (O3) has been included to assess poor air quality episodes that are forecasted during instances where wildfire smoke is transported into the Mid-Atlantic region or during high-pressure heat dome scenarios that promote O3 formation. Additionally, future flights will include storing gas samples in cannisters when plumes are intercepted which will then be processed in the lab to identify the isotopic signatures and other trace gases in the plume that would pinpoint the type of source being sampled. Lastly, coordinated efforts combining measurements from ground-based mobile platforms, drones, and aircraft are being developed for the Millersville landfill to address the spatial structure of GHGs emitted and how that changes over time and during different meteorological conditions.
Figure 1: (left) Flight conducted for 07/23/2025 to target compressor stations and landfills. (right) A zoom-in of the flight segment over the Ellicott City gas compressor station. The shading in the plots represents CH4 concentration and the multiple loops around the source enable an emission rate (ER) estimate of 437 g/s or roughly 13.7 kt/yr.
Sources Targeted
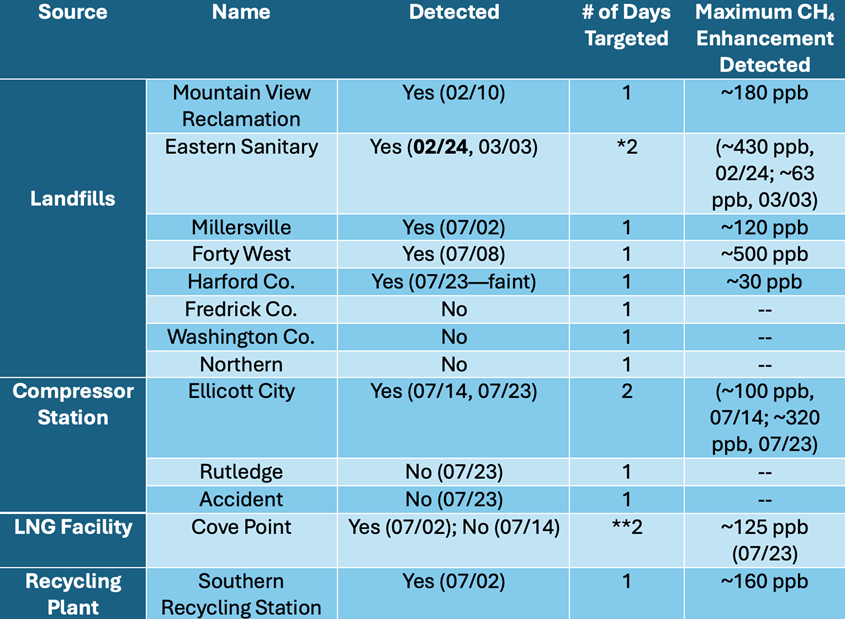
The table below lists the different sources targeted so far in 2025 separated by source type, name of source, whether emissions were detected (and on what date), the number of days targeted, and the estimated enhancement above background. In all, 13 CH4 sources have been targeted with the vast majority resulting in relatively large enhancements above background concentrations. Additional flights are planned to repeat surveys over these sites as well as expanding to other areas in Maryland where potential hotspots have been identified.
Table 1: List of sources by source type, date of detection, number of days targeted, and approximate maximum enhancement above background. The “*” indicates that emissions ‘possibly’ come from the Eastern Sanitary Landfill; however, more work needs to be done to confirm this; the “**” indicates only one of the days yielded a measurable enhancement of CH4.
Methods
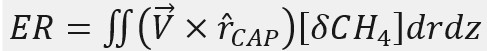
The flights conducted include loops around sources multiple times and multiple passes directly downwind from sources. Frequent sampling at different heights supports emission rate (ER) calculations through the mass balance approach, which combines the wind perpendicular to the flight path, concentrations upwind and downwind of the source, and location information. The flux across upwind and downwind portions of the flight is represented in Equation (1) as
where the cross product in parentheses represents the wind vector relative to the aircraft heading, as the enhancement above background, and the double integral representing the flux across the depth and width of the plume being sampled. The ER in Equation (1) quantifies the amount of mass emitted and is therefore a key calculation when informing MDE how much GHG is being emitted from the sources targeted.
Stakeholders: Maryland Department of Environment (MDE) and the National Institute of Standards and Technology (NIST)